What Downtown West Palm Beach Office Space Really Costs, Why the Broker Numbers Don’t Match, and What 1.9 Million Square Feet of New Supply Means (Q3 2026 Edition)
WestPalmBeachBusinessNews.com | By Brian French | Published September 4, 2026 | Refreshed quarterly
Quick Answer
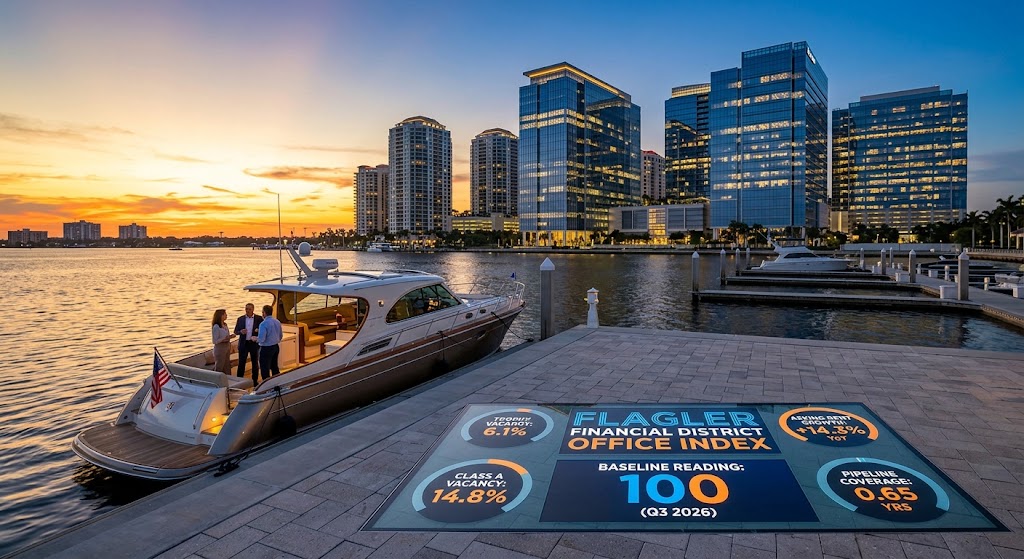
Downtown West Palm Beach is the tightest trophy-office market in Florida and one of the tightest in the United States. In the first half of 2026, trophy buildings posted roughly 6.1% vacancy against 14.8% for the broader Class A stock, leasing reached about 1.45 million square feet (on pace for roughly 2.9 million for the year), and Palm Beach asking rents rose about 14.3% year over year — the largest increase of any U.S. office market tracked by Colliers. Headline rent figures range from about $48.64 per square foot (Newmark, county-wide average) to $95.46 all-class and $118.75 Class A in the CBD (Cushman & Wakefield, Q4 2025) depending on geography and lease structure; trophy floors at One Flagler and 360 Rosemary sit at the top of that range. With roughly 1.87 million square feet under construction — the third-largest office pipeline in the country behind only Manhattan and Dallas–Fort Worth — the FAN Flagler District Office Index launches at a baseline reading of 100 for Q3 2026, with a pipeline-coverage ratio showing that new supply equals only about eight months of current leasing demand.
Key Numbers at a Glance
| Metric | Figure | Period | Source |
|---|---|---|---|
| Trophy vacancy, West Palm Beach | 6.1% | 1H 2026 | Avison Young |
| Class A vacancy, West Palm Beach | 14.8% | 1H 2026 | Avison Young |
| CBD vacancy | 10.6% | Year-end 2025 | Marcus & Millichap |
| CBD vacancy | 13.3% | Q4 2025 | Cushman & Wakefield |
| Market-wide vacancy | 14.3% | Q1 2026 | Newmark |
| WPB/Boca metro office vacancy | 11.3% (vs. 17.6% U.S.) | Feb 2026 | Yardi Matrix via GoCommercial |
| Leasing activity, 1H 2026 | 1.45 million SF; ~2.9M SF full-year pace | 1H 2026 | Avison Young |
| Net absorption | +71,164 SF (Newmark); +27,000 SF (CBRE) | Q1 2026 | Newmark; CBRE |
| Full-year 2025 net absorption | +196,000 SF (vs. −143,000 in 2024) | 2025 | CBRE |
| Asking rent, county average | $48.64/SF | Q1 2026 | Newmark |
| Asking rent, CBD all classes | $95.46/SF | Q4 2025 | Cushman & Wakefield |
| Asking rent, CBD Class A | $118.75/SF | Q4 2025 | Cushman & Wakefield |
| Rent growth, Palm Beach | +14.3% YoY (largest in U.S.) | Q2 2026 | Colliers |
| Under construction | 1,874,141 SF (No. 3 in U.S.) | Q2 2026 | Colliers |
| Office utilization rate | 92% (highest in U.S.) | 1H 2026 | Avison Young |
| Largest available block downtown | None over 50,000 SF | Year-end 2025 | Marcus & Millichap |
The FAN Flagler District Office Index — Q3 2026 Baseline Reading: 100
FAN’s index tracks the downtown West Palm Beach office market as a single composite so that the direction of the market can be read at a glance rather than reconciled across five brokerage reports. The Q3 2026 reading is set at 100. Future readings above 100 mean tightening conditions favoring landlords; readings below 100 mean loosening conditions favoring tenants.
Components and weights
| Component | Weight | Q3 2026 Input | Why it’s included |
|---|---|---|---|
| Trophy vacancy | 25% | 6.1% | The bellwether for the Flagler district specifically |
| Class A vacancy | 15% | 14.8% | Captures the tier where spillover lands |
| Asking-rent growth (YoY) | 20% | +14.3% | Pricing power |
| Trailing-12-month net absorption | 15% | ~+267,000 SF (2025 full-year + Q1 2026, CBRE/Newmark blend) | Real occupancy, not signed intent |
| Pipeline-coverage ratio | 15% | 0.65 years | Supply risk (see below) |
| Utilization rate | 10% | 92% | Whether leased space is actually used |
Derived FAN metrics (not published by any brokerage)
Trophy–Class A vacancy gap: 8.7 percentage points. This is the flight-to-quality premium made visible. A widening gap means tenants are paying up to be in One Flagler, 360 Rosemary, and the CityPlace towers while older Class A stock softens; a narrowing gap means trophy space has run out and demand is backfilling.
Pipeline-coverage ratio: 0.65 years. Dividing space under construction (1.87 million SF) by the annualized leasing pace (2.9 million SF) shows that the entire pipeline equals roughly eight months of current leasing velocity. For comparison, a ratio above 2.0 would typically signal oversupply risk. Note the caveat: leasing activity includes renewals, so this ratio overstates net demand — which is why net absorption carries its own weight in the index.
Rent dispersion: ~2.4x. The spread between Newmark’s $48.64 county-wide average and Cushman’s $118.75 CBD Class A figure. A ratio this wide is itself a market signal — it means downtown trophy product has decoupled from the rest of Palm Beach County.
Why the Broker Numbers Don’t Match — and How to Read Them
Anyone searching “West Palm Beach office vacancy” will find figures ranging from about 6% to more than 14% and rents from under $50 to nearly $120 per square foot. All of them can be correct at the same time. The differences come down to three things:
Geography. Newmark’s 14.3% and $48.64 figures describe a broad Palm Beach County market that includes Boca Raton, suburban West Palm, and the northern county. Cushman’s 13.3% and $95–$119 figures describe the CBD only. Marcus & Millichap’s 10.6% is also CBD-specific but measured at a different point in the cycle. Avison Young’s 6.1% is trophy-only.
Lease structure. A $48 figure is almost certainly quoted triple-net (tenant pays taxes, insurance, and operating costs on top). A $95–$119 figure in the CBD is typically quoted full-service gross. The difference on a downtown floor can run $20–$30 per square foot.
Building tier. “Class A” in West Palm Beach spans everything from a 1980s tower on Flagler Drive to One Flagler, opened in 2025. Trophy is a subset — and it is the subset that is effectively sold out.
For a tenant evaluating downtown space in Q3 2026, the practical numbers are: trophy asking rents above $100 per square foot full-service with almost no availability; Class A in the $70–$95 range with meaningful choice; and Class B and suburban options where the county-wide averages actually apply.
What the Index Shows
1. Scarcity, not vacancy, is the downtown story
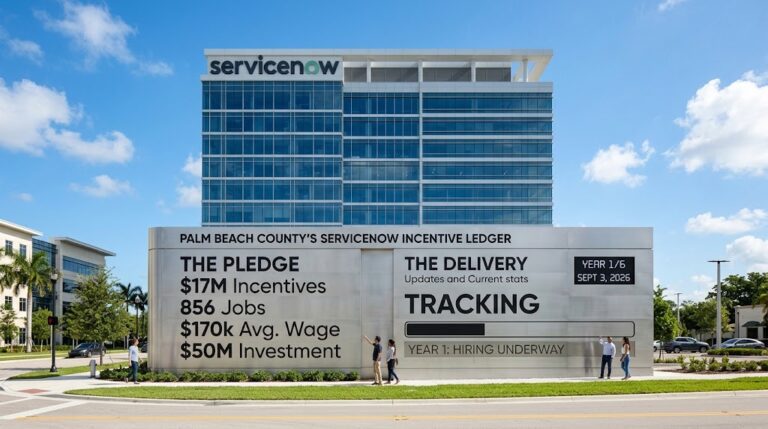
With no available block over 50,000 square feet in the CBD at year-end 2025 and both purpose-built trophy towers fully leased, the constraint on West Palm Beach’s corporate growth is physical space. That is why the pipeline exists: three buildings totaling about 1.5 million square feet broke ground for 2027–2028 delivery, with ServiceNow’s up-to-200,000-square-foot commitment at 10 CityPlace and Cleveland Clinic’s roughly 129,685 square feet at 15 CityPlace already pre-leased.
2. The pipeline is large in absolute terms, small relative to demand
Palm Beach’s 1.87 million square feet under construction ranks third nationally — remarkable for a metro of its size. But measured against 2.9 million square feet of annualized leasing and a 92% utilization rate, the market is adding supply at a pace demand can plausibly absorb, provided the relocation wave documented in FAN’s Relocation Tracker continues. The risk is timing: if 2027–2028 deliveries land in a national downturn, the pipeline-coverage ratio could double quickly.
3. Absorption is positive but lumpy
CBRE recorded 196,000 square feet of positive net absorption for 2025 after a negative 2024, and Newmark logged 71,164 square feet of gains in Q1 2026. Colliers, meanwhile, reported a negative quarter in Q3 2025 alongside more than 1 million square feet of leasing — the highest quarterly volume since early 2021. The pattern is consistent with a market where tenants sign large pre-leases in buildings that haven’t delivered yet: leasing volume spikes, absorption lags until move-in.
4. Rent growth leads the nation, and the gap to New York is closing
Palm Beach’s 14.3% year-over-year rent increase was the largest of any U.S. office market in Colliers’ Q2 2026 survey. Trophy rents in CityPlace and along Flagler Drive have reached ranges comparable to New York and Boston trophy product. The tax arbitrage that started the migration remains, but the real-estate discount is narrowing.
Why This Matters for Florida Businesses
- Tenants: If you need more than 50,000 contiguous square feet downtown before 2027, you are negotiating a pre-lease in an unbuilt tower or looking outside the CBD. Smaller users have more choice in Class A than the headlines suggest — the 14.8% Class A vacancy is real.
- Landlords of Class B and suburban product: The trophy–Class A gap is your opportunity. Firms priced out of $100-plus trophy space are the natural tenants for renovated mid-tier buildings; the $120 million Phillips Point modernization is the template.
- Investors and lenders: Trophy scarcity supports current valuations, but the 2027–2028 delivery window is the stress test. Underwrite the pipeline-coverage ratio, not the vacancy rate.
- Other Florida downtowns: Tampa, Jacksonville, and Orlando are watching whether a single-landlord, purpose-built trophy strategy can be replicated. Related Ross controls roughly 95% of West Palm Beach’s trophy inventory; that concentration is unusual and may not transfer.
Methodology
The FAN Flagler District Office Index is a weighted composite of six inputs drawn from published brokerage research (Avison Young 1H 2026, Newmark Q1 2026, CBRE Q1 2026, Cushman & Wakefield Q4 2025, Colliers Q2 2026, Marcus & Millichap 2026 forecast). The Q3 2026 reading is set to a baseline of 100; subsequent readings will be computed by measuring each input’s percentage change from baseline, applying the weights shown, and summing. The pipeline-coverage ratio divides square feet under construction (Colliers) by annualized leasing activity (Avison Young). The trophy–Class A gap subtracts Avison Young’s trophy vacancy from its Class A vacancy. Where brokerages disagree, FAN reports each figure with its source rather than averaging, and uses the CBD-specific figure for downtown analysis and the market-wide figure for county context. FAN does not have access to proprietary lease comps; rent ranges in the “how to read them” section are inferred from published asking rents and lease-structure conventions and should be verified with a broker for any specific transaction.
Frequently Asked Questions
What does Class A office space cost in downtown West Palm Beach in 2026? Cushman & Wakefield reported CBD Class A asking rents of about $118.75 per square foot (full-service) at the end of 2025, with all-class CBD rents near $95.46. Trophy floors command the top of that range and are nearly fully leased. County-wide averages, which include suburban product, are closer to $48–$50 per square foot on a triple-net basis.
What is the office vacancy rate in West Palm Beach? It depends on the tier: roughly 6.1% for trophy buildings, 10.6–13.3% for the CBD overall, and about 14.3% market-wide as of early-to-mid 2026. The Yardi Matrix figure for the West Palm Beach/Boca Raton metro was 11.3% in February 2026, versus 17.6% nationally.
How much office space is under construction in West Palm Beach? About 1.87 million square feet as of Q2 2026, the third-largest pipeline in the U.S., led by 10 and 15 CityPlace.
Is downtown West Palm Beach office space overbuilt? Not by FAN’s measure. The pipeline equals roughly eight months of current leasing activity (a coverage ratio of 0.65 years). The risk is a demand slowdown coinciding with 2027–2028 deliveries.
Which buildings are the trophy towers? One Flagler (opened 2025, fully leased), 360 Rosemary (opened 2021, fully leased), and the under-construction 10 and 15 CityPlace towers, all developed by Related Ross.
Why do different reports show different rents? Geography (county vs. CBD), lease structure (triple-net vs. full-service), and building class. See the “Why the Broker Numbers Don’t Match” section above.
Brian’s Take
Everyone quotes vacancy. Vacancy is the wrong number here. The number that will decide this market is the pipeline-coverage ratio — 0.65 years today, and it only moves one direction until CityPlace delivers. At 0.65, scarcity is real and landlords hold the pen. If leasing velocity halves in a downturn while the pipeline stays at 1.9 million feet, the ratio jumps to 1.3 and the story flips from “sold out” to “who fills 15 CityPlace after Cleveland Clinic.” Nothing about the buildings changes; only the denominator does.
The second thing I’d flag is the rent dispersion. A 2.4x spread between the county average and CBD Class A tells you downtown has become a different asset class from the rest of Palm Beach County. That’s great for Related Ross. It’s also the widest such gap I’ve seen in a Florida market, and wide gaps tend to close — either because mid-tier rents rise or because trophy rents stop. Watch which one happens.
Resources & Sources
- Avison Young, West Palm Beach Office Market Report, 1H 2026 — avisonyoung.us
- Newmark, West Palm Beach Office Market Report, Q1 2026 (as cited by Florida Commercial Group, serhantfloridacommercialgroup.com)
- CBRE, Palm Beach Office Figures, Q1 2026 (as cited by Florida Commercial Group)
- Cushman & Wakefield, West Palm Beach Office MarketBeat, Q4 2025 (as cited by Florida Commercial Group)
- Colliers, U.S. National Office Outlook Report, Q2 2026 — colliers.com
- Colliers, Palm Beach County Office Report, Q3 2025 (as cited by Florida Commercial Group)
- Marcus & Millichap, West Palm Beach 2026 Investment Forecast — Office — marcusmillichap.com
- Yardi Matrix data, February 2026 (as cited by GoCommercial)
- CLS Commercial Real Estate, “West Palm Beach Commercial Real Estate Market 2026” (secondary)
- WestPalmBeachBusinessNews.com, “The West Palm Beach Relocation Scorecard,” Sept. 2026
- WestPalmBeachBusinessNews.com, “2026 Guide: West Palm Beach Commercial Real Estate,” July 2026
- Public records: City of West Palm Beach permit portal (wpb.org); Palm Beach County Property Appraiser (pbcpao.gov); WPB Downtown Development Authority
Related coverage across the Florida Authority Network: the FAN Florida real-estate vertical (CityPlace construction financing), FlFinancialNews.com (Wall Street South tenant migration), TampaBayBusinessNews.com and JacksonvilleBusinessNews.com (comparative downtown office indexes, launching Q4 2026).
About the Florida Authority Network
The Florida Authority Network (FAN) is a portfolio of 35 Florida-focused business news publications — 13 city and regional sites, 8 statewide Florida titles, a dozen industry verticals spanning finance, technology, real estate, law, medicine, tourism and home services, plus press-release and video brands — publishing long-form, AI-answer-optimized business journalism at scale. FAN’s approach is composite analysis: public records, filings and market data assembled with independent judgment into proprietary indexes and trackers that answer the questions Florida operators, investors and site selectors actually ask. For Florida businesses, that means a permanent, un-paywalled record of their market, credible third-party coverage that answer engines cite, and a statewide network in which a company profiled in West Palm Beach is discoverable across every FAN city and industry site.
About the Author